YMCA Aquatics Safety
Learning Design
Multimedia safety training, staff continuing education, and data-informed coaching materials developed for lifeguard staff and competitive swimmers at YMCA San Francisco.
Designing for safety
At YMCA San Francisco, I design and deliver aquatics safety training that moves beyond compliance formats — building content that is visually clear, scenario-grounded, and worth paying attention to. The work spans slide-based staff in-service training, public-facing safety infographics, and a longitudinal performance analytics system for competitive swimmers. Each artifact reflects a different set of multimedia and design skills, built on one foundation: if learners don't engage with it, it doesn't save lives.
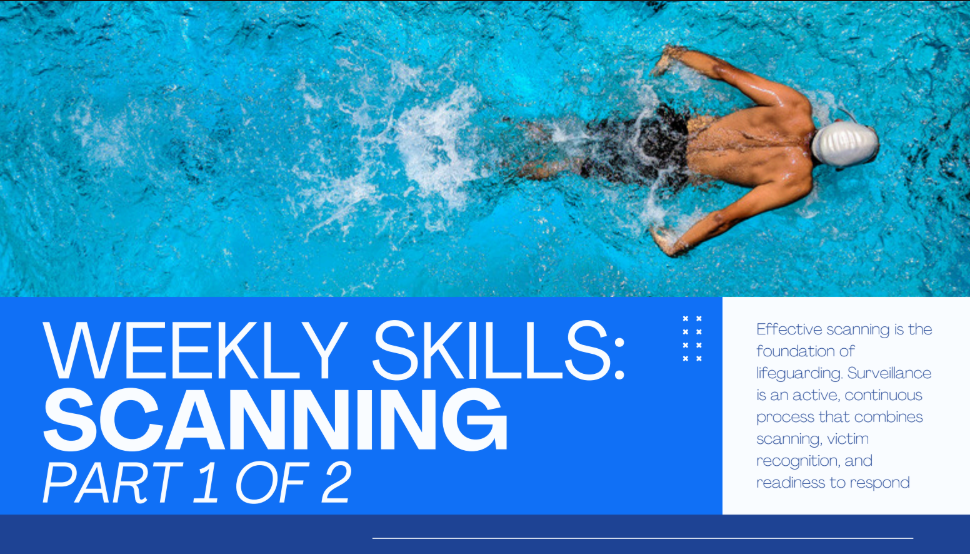
Weekly Skills: Scanning & Surveillance
A modular slide series translating American Red Cross surveillance guidelines into engaging, discussion-ready in-service sessions. Each deck is structured around a clear instructional thread: what to look for, how to look for it, what gets in the way, and how to stay ready to act.
 View Document ↗
Skills demonstrated
- Standards translation (American Red Cross guidelines → learner-facing content)
- Scenario-based framing and reflective prompts
- Backward design from competency outcomes
- Modular structure for recurring in-service use
- Slide layout and typography for staff training context
- Photography selection and editorial cropping
- Visual hierarchy to guide attention and discussion
- Consistent design system across a multi-part series
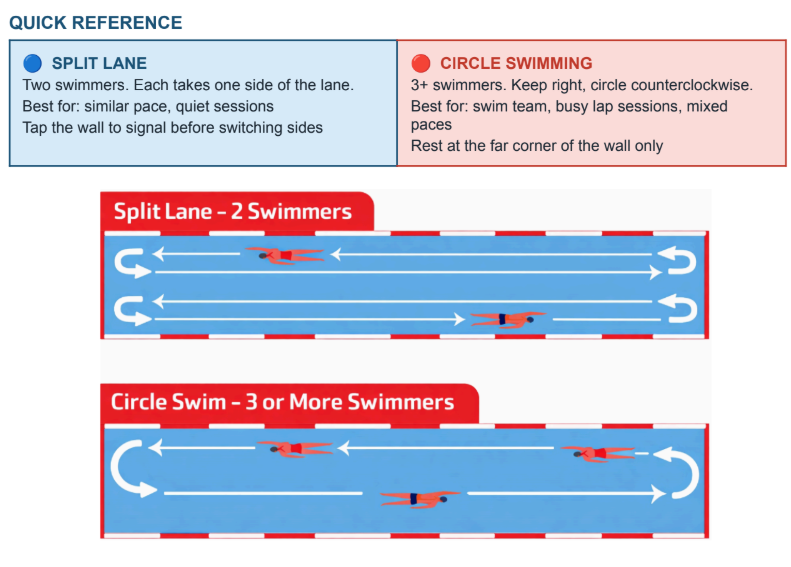
Lane Management Techniques
A one-page training reference covering the five key lane management skills every lifeguard needs — framed not as rules, but as a prevention and communication system. Opens with a live scenario that puts staff immediately into a decision-making posture.
 View Document ↗
Skills demonstrated
- Scenario-first hook designed to activate prior experience
- Ready-to-use scripts for patron interaction
- Conflict de-escalation framing with empathy + authority structure
- American Red Cross citation and sourcing throughout
- Single-page reference format for poolside use
- Diagram design: split vs. circle lane illustrations
- Typography and layout hierarchy for quick scan readability
- Color coding to differentiate lane types at a glance
Hypoxic Blackout — Public Safety Communication
A public-facing safety infographic explaining the physiological sequence that leads to hypoxic blackout — a drowning mechanism that is invisible, silent, and widely misunderstood. Designed for display in pool areas and digital safety channels, accessible to patrons and staff alike.
The design challenge: translate dense physiology into a four-stage visual sequence that communicates clearly to someone who has never heard the term "hypoxic blackout" — and does so in seconds.
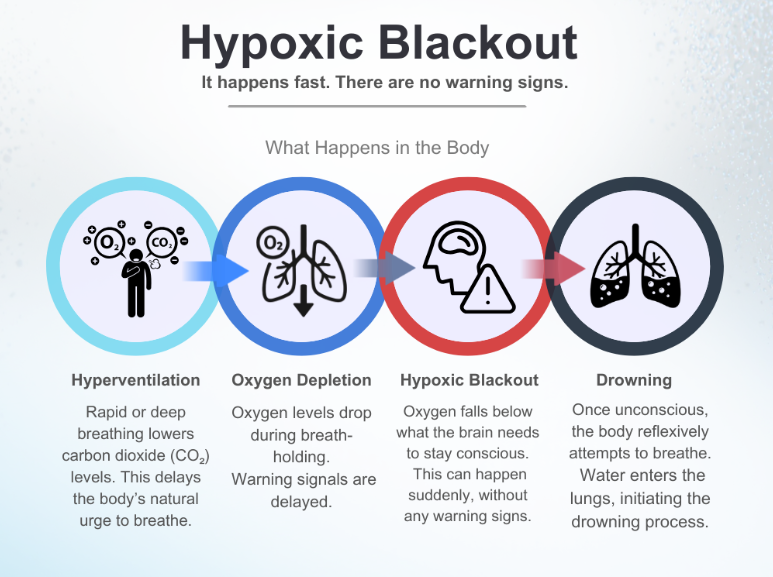
Hypoxic Blackout infographic · Designed for YMCA Presidio pool display and digital distribution
Key design decision: The headline leads with urgency — "It happens fast. There are no warning signs." — before the physiology begins. This respects the reader's cognitive load by anchoring the stakes before introducing mechanism.
Skills demonstrated
- Sequential diagram design with escalating visual urgency
- Icon and symbol selection for physiological concepts
- Color progression (blue → red → dark) encoding severity
- Layout hierarchy: headline → subtitle → process → detail
- Plain-language translation of cardiorespiratory physiology
- Zero-jargon writing for mixed public audience
- Cognitive load management through visual chunking
- Dual-channel design: icons + text reinforce each other
Swimmer Performance Analytics & Development Report
A longitudinal performance tracking and reporting system built for the competitive swim program — generating individualized coaching reports that integrate multi-meet data with stroke-by-stroke diagnostic analysis and targeted development plans.
.png)
Multi-Stroke Performance Overview · Season 2025–26 · Age 14 · BB–A performance range
Skills demonstrated
- Longitudinal performance tracking across 130+ swimmers
- Benchmarking against group averages and national standards
- Pattern recognition: technical vs. conditioning gaps
- Data visualization for coaching and parent communication
- Individualized report structure from data to prescription
- Typography and layout for print and digital use
- Translating quantitative analysis into actionable coaching language
- Drill and dryland recommendations mapped to specific data signals
What ties this work together
Each artifact is multimedia content in a different format — slides, infographic, data report — but they share a common design logic: start with the learner's actual situation. A lifeguard at a busy pool. A patron reading a safety poster. A coach preparing for practice. The skills that show up across all four pieces — visual hierarchy, plain-language writing, cognitive load management, scenario grounding, data translation — are the same skills I bring to every learning design context.
- Slide deck design (Google Slides / PowerPoint)
- Infographic design and layout
- Data visualization and performance reporting
- Photography selection and editorial composition
- Backward design from safety competency outcomes
- Scenario-based and reflective learning design
- Cognitive load management and chunking
- American Red Cross standards alignment and citation
- Typography and layout hierarchy
- Color systems encoding meaning and urgency
- Icon and diagram design for non-technical audiences
- Dual-channel design (visual + text reinforcement)
- Audience analysis and plain-language writing
- Format selection (slide vs. reference sheet vs. infographic)
- Data-to-narrative translation for coaches and staff
- Modular design for repeated and updated use